
DATA & AI
ENTHUSIAST
Passionate in solving complex TECH BASED business problems
BRINGING TO THE TEAM
Data ANALYTICS AND VISUALIZATION
Transform Data into Insights: I specialize in converting raw data into actionable insights using advanced tools like Tableau, Knime, and Excel. I create dynamic visualizations that help understand complex data trends and make informed decisions. Statistical Analysis: Leveraging techniques such as regression analysis, clustering, and classification, I can uncover hidden patterns and relationships within your data, providing a solid foundation for strategic planning.
Machine Learning and AI Solutions
Predictive Modeling: With experience in machine learning algorithms like LSTM, CNN, and random forests, I develop robust predictive models that can forecast trends, detect anomalies, and optimize operations. Custom AI Applications: I offer tailored AI solutions to meet your specific business needs, from developing AI-driven applications to creating advanced neural network architectures, enhancing efficiency and decision-making processes.
BIG DATA AND CLOUD
Efficient Data Processing: With expertise in Apache Spark, Hadoop, and cloud platforms like Azure and AWS, I design and implement high-performance data pipelines that handle large volumes of data. Database Management: Skilled in both SQL and NoSQL databases, including MySQL, PostgreSQL, and MongoDB, I can ensure your data is well-organized, secure, and easily accessible for analysis. ETL: I handle robust data pipelines and integrating them from cloud databases into data warehouses and data lakes depending on the business needs.
EDUCATION


WORK EXPERIENCE


BUSINESS INTELLIGENCE PROJECTS
BMW Sales Reporting Dashboard

Pricing Strategy Dashboard for Legal Consulting Firm

Netflix Dashboard

49ers vs. Chiefs Trend Analysis
MACHINE LEARNING PROJECTS
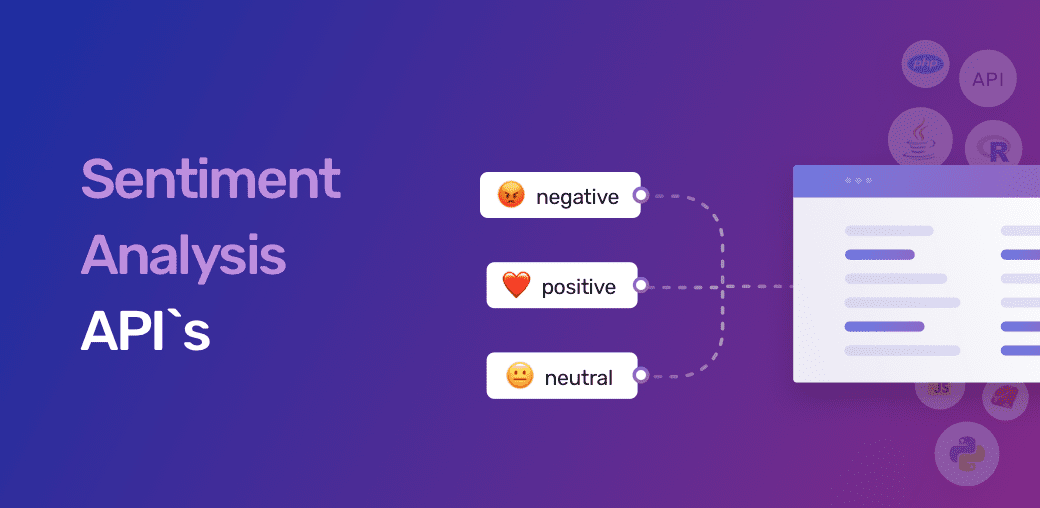
Fine-Tuning BERT for Sentiment Analysis on Movie Reviews
This project aims to harness the capabilities of BERT (Bidirectional Encoder Representations from Transformers), a leading pre-trained language model, to perform sentiment analysis on movie reviews. By fine-tuning BERT on a dataset of movie reviews, the model will learn to classify reviews as positive or negative. The project includes data preparation, model training, and evaluation to ensure high accuracy. Furthermore, a FastAPI application will be developed to serve the model, making it accessible via a web interface where users can input reviews and receive instant sentiment predictions. This integration provides a powerful tool for understanding audience sentiments in real-time.
Handtracking Module using OpenCV and Mediapipe
This project leverages cutting-edge computer vision technology to enable real-time hand detection and landmark recognition using MediaPipe and OpenCV. Implemented with a Flask backend, it processes video frames to identify and track hand movements and gestures. The frontend, built with HTML and JavaScript, captures video input from the user’s webcam and interacts seamlessly with the Flask server to display annotated hand positions. This project’s technical prowess lies in its efficient use of MediaPipe’s robust hand tracking capabilities, combined with Flask for smooth data processing and real-time updates. Key functions include detecting multiple hands, identifying hand landmarks, and providing visual feedback through the browser. Merits of this project include enhancing user interactions, offering a hands-free interface, and potential applications in virtual reality, remote control systems, and assistive technologies. Its lightweight design ensures accessibility and ease of deployment across various platforms.

TrioCare: Advanced 3+ Disease Prediction with Support Vector Machine
This project comprises three robust models designed to predict heart disease, diabetes, and Parkinson’s disease, each utilizing a Support Vector Machine (SVM) with a linear kernel for classification. The diabetes model uses the PIMA Diabetes Dataset, incorporating health indicators like glucose levels and BMI, while the heart disease model uses features such as cholesterol levels and maximum heart rate from the Heart Disease dataset. The Parkinson’s disease model utilizes biomedical voice measurements. Each model is created using meticulous data preprocessing, feature extraction, and training using the SVM classifier, achieving 85% accuracy scores on both training and test sets, demonstrating the effectiveness of machine learning in medical diagnostics, providing reliable predictive systems for new patient data based on specific health parameters. You can try my BETA version below.
Advanced Self-Driving Car Project: Precision Steering Angle Prediction Using CNN
Initially, data was ingested from simulation tool ‘Udacity‘, generated a driving log with over 17,000 images from central, left, and right cameras, along with parameters such as steering angles, throttle, reverse, and speed. The dataset underwent meticulous preprocessing and normalization, including path extraction and histogram equalization to address data imbalance. Utilizing TensorFlow and Keras, a convolutional neural network (CNN) with five convolutional layers and three fully connected layers was architected to extract spatial features and predict steering angles. To enhance the model’s generalization, data augmentation techniques such as 20% brightness adjustments, 15-pixel translations, and horizontal flips were implemented to simulate diverse driving conditions. The model was trained over 25 epochs with a batch size of 32, employing advanced methodologies like batch normalization and a dropout rate of 0.5 to prevent overfitting and ensure stability. Performance was evaluated using mean squared error (MSE), achieving a low loss of 0.02. After testing, the model was able to learn well and adapt on its own, even in unknown driving conditions achieving a well generalized model. This project showcases technical prowess in integrating deep learning techniques for real-time steering command inference, significantly contributing to the field of autonomous vehicle technology and demonstrating the capability to deploy a robust CNN model for self-driving car navigation.

Q&A Chatbot for PDF's with Gemini Pro LLM
This project is a machine learning based web application that enables users to upload and interact with PDF documents through natural language queries. Utilizing PyPDF2 for text extraction, `RecursiveCharacterTextSplitter` for text chunking, and `GoogleGenerativeAIEmbeddings` for converting text into embeddings, the application stores these embeddings in a FAISS index for fast similarity searches. The conversational AI, powered by `ChatGoogleGenerativeAI` with the “Gemini-pro” model, uses a custom prompt template to generate accurate and contextually relevant answers. Users can upload multiple PDFs, ask questions via a user-friendly interface, and receive real-time responses. This project leverages technologies such as LangChain, FAISS, and Google Generative AI to create an efficient and interactive tool for querying document content, demonstrating the integration of advanced AI and data visualization to enhance user experience.
DATA ANALYTICS/ENGINEERING PROJECTS


Data Integration and Pipeline Modeling using Knime for Yelp Data
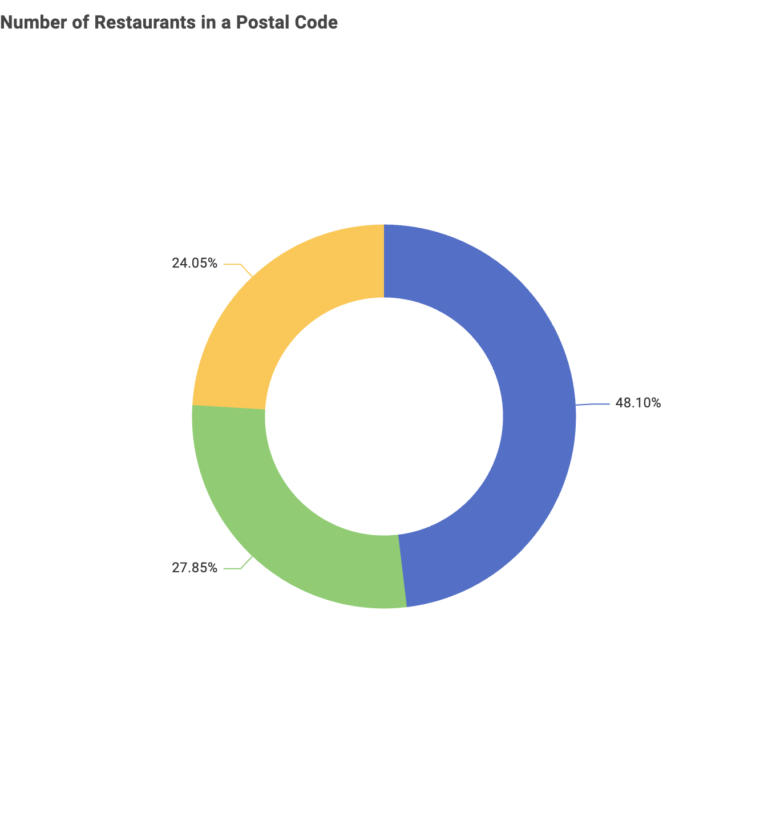
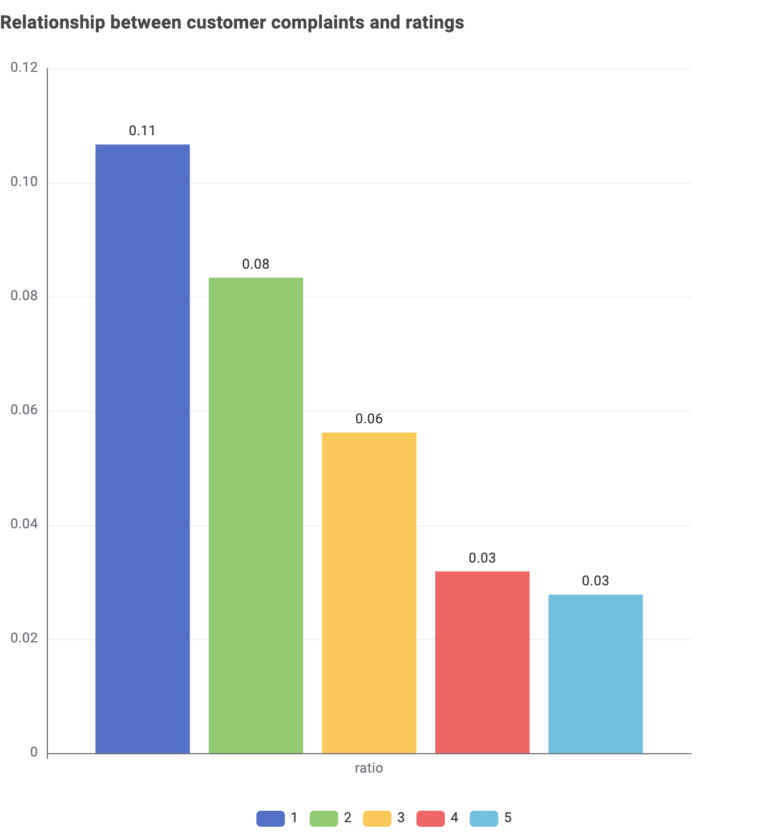
This project involved extracting a substantial dataset of 1.5 million JSON records from the Yelp database, followed by the integration and management of this data within a MongoDB cluster. The primary objective was to perform comprehensive data engineering techniques to facilitate in-depth analysis and visualization of restaurant performance metrics across various dimensions. This Knime workflow included data retrieval, transformation, and the generation of insightful visualizations like bar charts and scatter plots to explore correlations between restaurant ratings, review counts, customer complaints, and other operational metrics. The analyses aimed to identify patterns and trends that could inform strategic decisions for restaurant management and location-based marketing strategies. Key insights were derived from grouping and filtering data to understand the impact of customer satisfaction and operational attributes on restaurant success, particularly in the Orlando area, highlighting potential hotspots for new restaurant ventures.
Contact
Champaign, IL, USA

